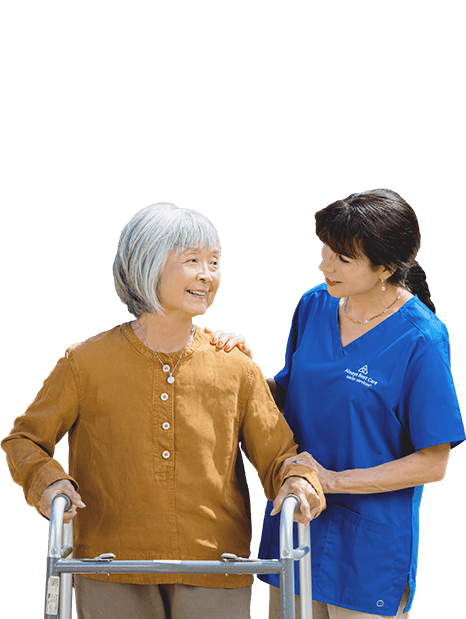
Team of Caring Professionals
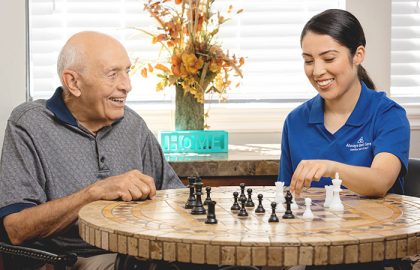
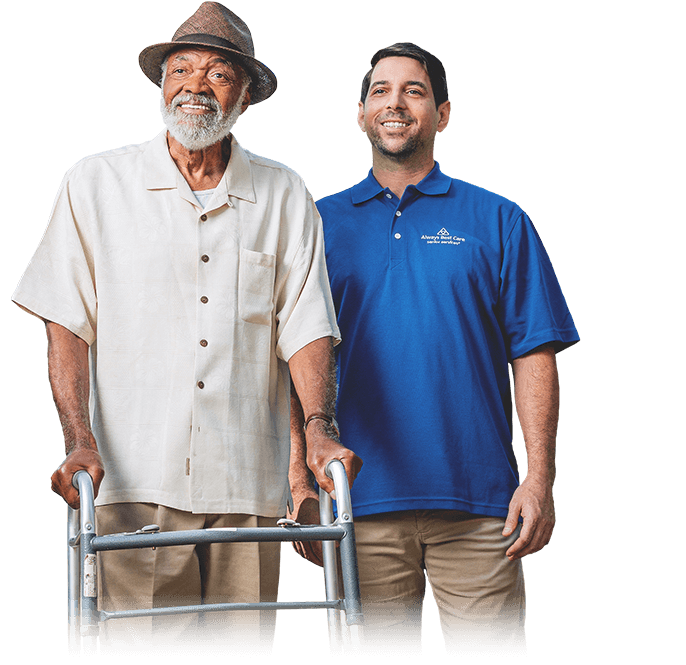
We are a team of caring and compassionate professionals working together to provide the best possible care for you and your loved ones
Please submit this form below and we will chat shortly!
Always Best Care combines national strength and standards with local accessibility and personal service. Your local Always Best Care team will be helping families throughout Conejo Valley and surrounding communities from Thousand Oaks to Malibu providing non-medical in-home care, independent and assisted living referral services. We have strong relationships with hospitals, social workers, senior communities and senior resources across the region. All caregivers at Always Best Care are trained and insured to provide the safest and highest level of personal care.
We match our clients with the most appropriate living options

We are a team of caring and compassionate professionals working together to provide the best possible care for you and your loved ones
We have worked with thousands of seniors and their families across the U.S. and Canada, providing the best service each step of the way
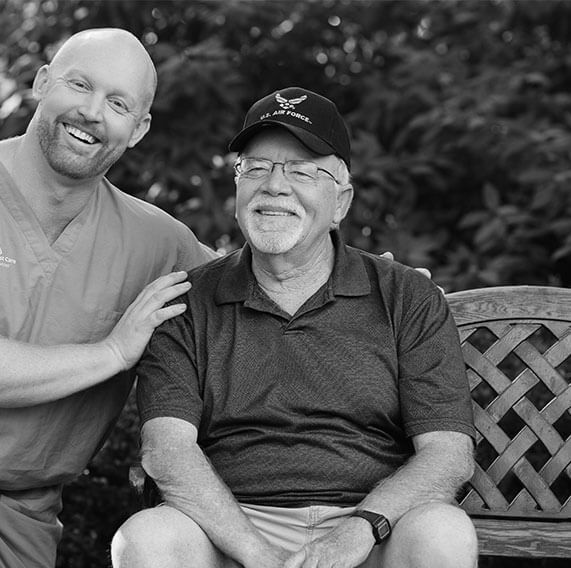
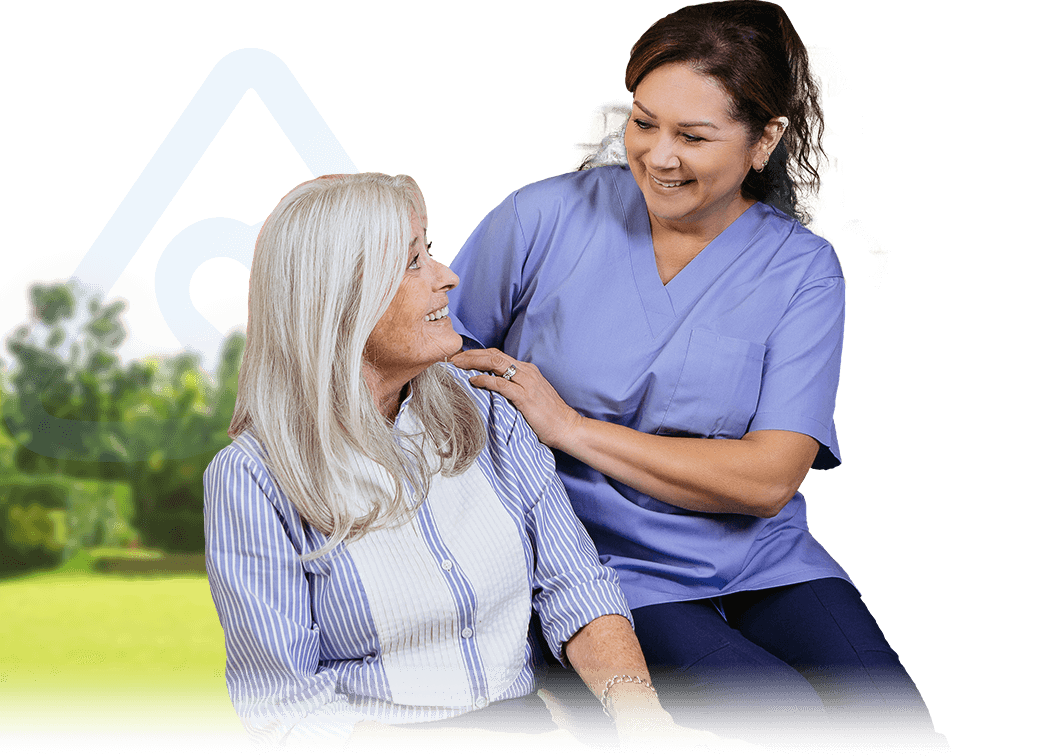
Our team of professional caregivers has a proven track record of providing expert care to seniors and people with special needs
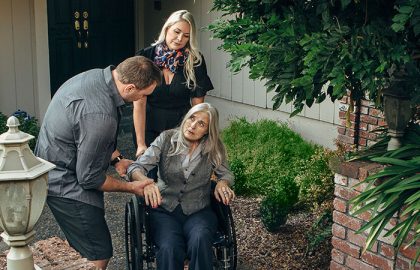
We help people with specific needs maintain a safe, independent, and dignified lifestyle with in-home care, senior community referral services and special care services
Discover our services to find the right care solution for you and your loved ones

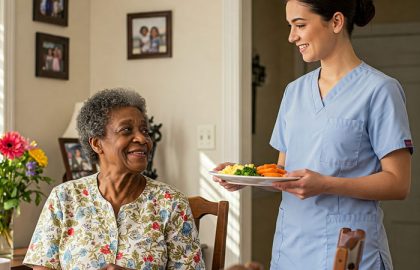
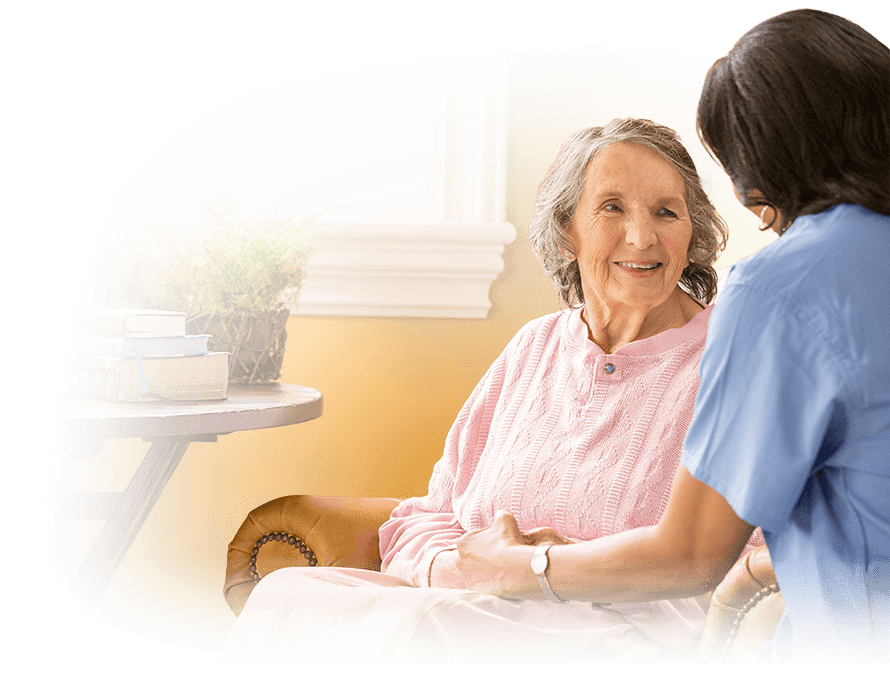
Expert care services, delivered in the comfort of your home
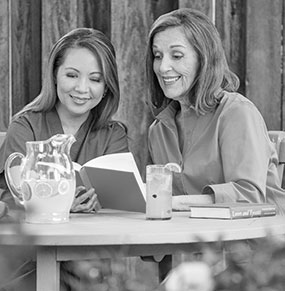
Referral services designed to help you find the right senior living community
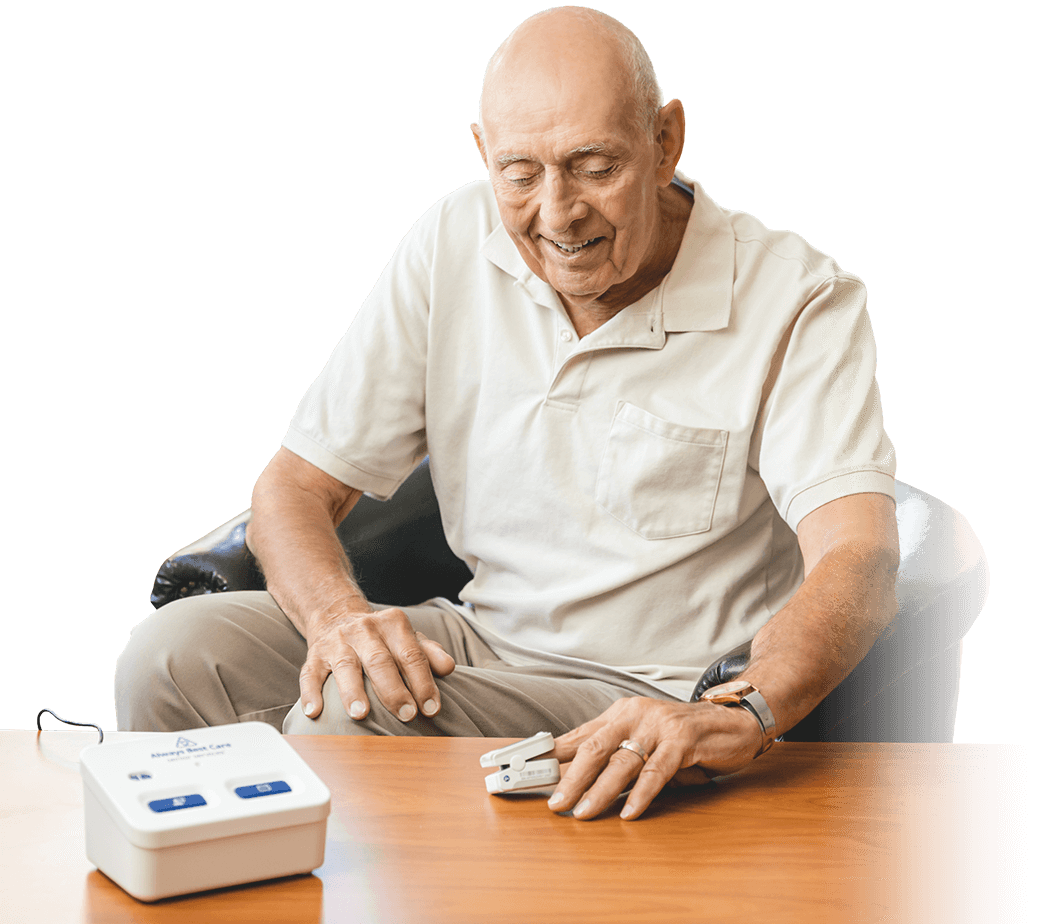
Specialized health monitoring services, powered by advanced healthcare technology
Helping veterans navigate the financing options available from the VA to receive the best care possible
Your local Always Best Care team helps families throughout Thousand Oaks and the surrounding areas

ALWAYS THERE FOR YOU ALWAYS BEST CARE
“I have partnered with Tom in Thousand Oaks for a couple years now, I can”
“Caring and sensitive. David is so focused on helping families. He is such an asset”
“Always Best Care has been helping my 94 year old Mother very much! The Caregivers”
“Been with the company for approximately like 6 months ,love it , great supervisors n”
“I’ve worked with a few agencies and my experience with Always Best Care has been”
“I’ve worked with ABC for over a year now. I’ve worked for other organizations”
“I am a past client of this provider Nisa was a great friend to my father and”
“I am a past client of this provider Nisa is the best. Upbeat, knows what she’s”
“After researching several Home Health Care companies in my area, I choose Always Best Care”
“First let me say that this review was not solicited by any one at Always”
“I am making this post on the behalf of my mother in law who does”
“I am making this post on the behalf of my mother in law who does”
“I am a current client of this provider We are with Always Best Care. We have”
“Tom and his team of caregivers do a great job. I highly recommend Always”
“I’m a registered nurse and having Erin help me with this process was seamless. She”
“I’ve been with the company a lil over 3months maybe longer and love the respect”
“This is the finest company in home care, I would highly recommend it for your”
“Stellar service and care! Highly recommend!”
“This is truly a team you can trust to take care of your loved one.”
“I have partnered with Tom in Thousand Oaks for a couple years now, I can attest that he strives to provide the best quality care for his clients and a positive work environment for his employees. Great agency! Highly recommend!”
“Caring and sensitive. David is so focused on helping families. He is such an asset to our hospital. Families don’t know where to start and David gets the ball rolling and smooths the way. What a blessing to these families.”
“Always Best Care has been helping my 94 year old Mother very much! The Caregivers are wonderful and helpful and willing to go the extra mile. I am so happy to have their team a part of our lives! Thank you!”
“Been with the company for approximately like 6 months ,love it , great supervisors n boss , overall great company for work for , great communication from supervisors ,n always a pleasure to work with wonderful clients”
“I’ve worked with a few agencies and my experience with Always Best Care has been phenomenal. The professionalism.and respect they show to us caregivers makes me feel appreciated as well as giving me opportunity to learn and grow in my services I provide to my clients with the workshops they provide every month.”
“I’ve worked with ABC for over a year now. I’ve worked for other organizations that provide senior care services but the Always Best Care Thousand Oaks location has been a wonderful place to work. The working relationship between staff, client and ownership/management is that it’s important for us all to be happy. I’ve been placed with so many wonderful people that I can say are not only my clients but also my friends. They really try to provide the right client with the right caregiver and with me it has been a wonderful experience and a great place to work.”
“I am a past client of this provider Nisa was a great friend to my father and treated him like family. It was reassuring to us to know he was looked after by a loving and caring person. She was always available to us and she was able to adjust her schedule to his needs. Nisa allowed my father to stay in his home longer and provided him new freedom he had not had previously.”
“I am a past client of this provider Nisa is the best. Upbeat, knows what she’s doing, was great with my mom. We all felt very comfortable when she was caring for mom.”
“After researching several Home Health Care companies in my area, I choose Always Best Care and was extremely pleased with the decision I made. Always Best Care checked every box on my list and was the absolute best choice for my post-surgery needs. Start to finish, the entire organization was professional, responsive, and provided the services I was in need of. Caregivers were exceptional in responding to my needs in addition to providing warm companionship that aided in a worry free recovery. Always Best Care delivered as promised and I highly recommend them for Home Health Care needs. MMD”
“First let me say that this review was not solicited by any one at Always Best Care Senior Services. The services provided by Always Best are both personal and professional. All of my calls were always answered by Tom ( the owner). Never was I left to wonder if I was going to get assistance for my mother and her significant other. From the top down I found everyone to be patient, kind, attentive, accessible, problem solvers, with an “I can get it done” attitude. The services provided by Always Best, required end of life care. The care givers worked seamlessly with Hospice. Every step of the way I could see both my mother and the patient were lovingly cared for. I look forward to using this agency as needed for my mother. Thank you, Tom and all of your care angels!”
“I am making this post on the behalf of my mother in law who does not currently have a Gmail account. Always Best Care has been a true blessing with providing a wonderful caregiver who is kind, patient and supportive with my 95 year old mother’s needs which include a downward cognitive slide. My mom enjoys the support and care too. I’ve heard horror stories about such services, but have been beyond pleased with Tom and his caregiving agency. Lori Robinson- Ventura County”
“I am making this post on the behalf of my mother in law who does not currently have a Gmail account. Always Best Care has been a true blessing with providing a wonderful caregiver who is kind, patient and supportive with my 95 year old mother’s needs which include a downward cognitive slide. My mom enjoys the support and care too. I’ve heard horror stories about such services, but have been beyond pleased with Tom and his caregiving agency. Lori Robinson- Ventura County”
“I am a current client of this provider We are with Always Best Care. We have been with them for two weeks now. They were great, and we have had a good experience so far. The caregiver is great. She has been like a lifeline for us; she has been nice. The scheduling has been fine, and everything has been working great.”
“Tom and his team of caregivers do a great job. I highly recommend Always Best Care of Thousand Oaks.”
“I’m a registered nurse and having Erin help me with this process was seamless. She is comforting, empathetic, and very knowledgeable. Thanks again Erin! Natalie Schauwecker, RN”
“I’ve been with the company a lil over 3months maybe longer and love the respect they give us caregivers and employees. We are a team as they say welcome to the team and it truly is a team more like a family here. They take our schedules and work with us and don’t pay us low as all other places. You get what you pay for. I’ve worked for Disneyland Resorts and this is much like the atmosphere there very friendly and non judgemental and truly caring understanding team. Tom the owner is one of us he doesn’t put himself above us neither does Erin. They are both friendly. Moving up in the company is possible as i have already and my kids are much happier because mommy actually loves her job. No one is paying me to write this i don’t do reviews typically because the time it takes but i believe in our team amd if you want great care and affordable care please try us for a week and I personally guarantee you, you’ll be the next to write a review.”
“This is the finest company in home care, I would highly recommend it for your family!”
“Stellar service and care! Highly recommend!”
“This is truly a team you can trust to take care of your loved one. It is obvious, Tom and his team have a passion for the work they do. They are so patient and kind and treated us and our loved one like one of their own members of the family. We are forever grateful.”
Discover our porfolio of technology and special care services, designed to cater to the needs of you and your loved ones.
A complimentary telephone reassurance program that provides companionship to seniors and disabled adults
A computerized balance analysis tool that provides an objective, accurate, and reliable fall risk analysis
Providing around the clock data-based insights and recommendations
Always Best Care helps seniors and their family through the entire process. Our care coordinators are local and have in-depth knowledge of our senior living partners and services.

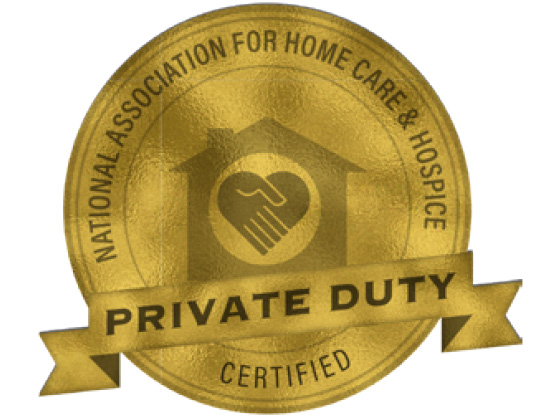
We are very proud of our awards and recognitions of excellence in the senior care industry
Our passion for helping people maintain a safe, independent and dignified lifestyle represents the strong foundation of
Always Best Care

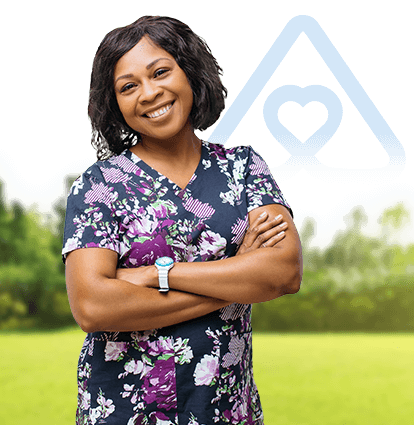
Our employees are our own – not contractors. Caregivers are thoroughly screened, trained and insured. We are dedicated to exceeding your expectations…always.
Whether you are an experienced caregiver or looking to launch your career, contact us today to learn about opportunities that may be available in your area


It’s becoming more and more common for families to live far apart from each other, and leaving an elderly relative alone at home can be a major source of anxiety if you’re not nearby. Always Best Care provides the reassurance you need that your loved ones are safe and happy, with a compassionate caregiver available in case of an emergency. We’ll help them handle their daily tasks so that you can manage your own life with confidence and peace of mind. In addition, home care is often considered a healthier and more affordable option for families when compared to long-term nursing facilities.
Choosing an in-home senior care provider can be a daunting task. However, there are a few guidelines to keep in mind. First, ask your friends and family for recommendations. If you’re unable to get any suggestions, search for local and state organizations that recognize the best providers in the industry. Doing so can help narrow down a shortlist of home care agencies. Next, set up meetings with your top choices and ensure that they meet your criteria. Don’t forget to ask your senior for their opinion, too. Doing so will help you make an informed home care decision.
When hiring an in-home care provider, it’s important to ensure that they are insured to protect you and your loved one. Always Best Care not only provides our clients with insurance coverage but also Worker’s Compensation. That way, in the unlikely event that an accident occurs while a caregiver is working in your loved one’s home, you are protected against any claims or damages. These protections not only benefit you and your loved one, but also directly benefit our caregivers, enabling us to attract some of the most skilled and compassionate individuals for Home Care in Thousand Oaks.
In the mid-90s, Always Best Care founder Michael Newman grew frustrated by the lack of resources available for seniors in his community. That frustration helped him shape a vision: to create a home care company that would provide trusted care, compassionate support, and professional advice for seniors and their loved ones. In 1996, Michael channeled his frustration into founding Always Best Care, which has since become one of the nation’s leading providers of in-home care for seniors. Today, people with passion continue to make Always Best Care what it is today. While times may change, our company’s commitment to compassionate home care will always remain the same.
To provide the best home care in Thousand Oaks, we believe that it’s crucial for seniors and their caregivers to build a strong relationship that is fortified with trust. Without it, all parties can suffer. However, at Always Best Care, our caregivers are allowed requested vacations. There may also be times when caregivers become ill. In such cases, a substitute caregiver takes responsibility for your loved one’s care. We inform the substitute caregiver about all your loved one’s likes and dislikes to minimize disruptions. If additional care is required in the morning, afternoon, and evening, we will do our best to accommodate.
We understand that many seniors can lead mostly independent lives, but occasionally they may need assistance. At Always Best Care, we’re thrilled when we can schedule a caregiver in a very short turnaround. That’s why we’re happy to offer part-time in-home care for seniors in Thousand Oaks. Our team of compassionate caregivers can be `available to assist your senior loved one morning, noon, and night.
Our home care providers in Thousand Oaks can assist with a wide range of services to help your senior live a fulfilling, independent life at home. Some of our most requested home care services include the following:
• Light Housekeeping
• Medication Reminders
• Community Activity Escorts
• Companionship
• Meal Prep
• Nutrition Monitoring
• Incontinence Care
• Transportation and Errand Running
• Dressing and Grooming
Contact our Always Best Care office today to learn more about the additional home care services we offer.
We believe that safety is one of the most important aspects of home care in Thousand Oaks. As such, we train our caregivers to assess your senior loved one’s home to identify any potential hazards that could lead to accidents. Before providing in-home care services, we will perform a safety assessment of your loved one’s property to identify ways to make their home safer. This may include introducing grab rails in hallways or showers or making other small changes. To ensure ongoing safety measures are met, your caregiver will continue to monitor your senior’s mobility and recommend any necessary equipment or technology to make their life easier and safer.
Yes. We understand that, with time, a senior’s home care needs can change. If they do, your Care Coordinator will be there to re-evaluate and adjust your non-medical home care services in Thousand Oaks as needed.
Our senior home care providers in Thousand Oaks are dedicated to delivering compassionate, exceptional care. That dedication often translates to specialized training and preferred areas of focus. Please don’t hesitate to inform us of any unique health needs or requirements your loved one has during your care consultation with Always Best Care.
Explore the latest insights, trends, and tips from the home care and caregiving industry
We have partnered with the best groups and institutions to provide the best care for you.